
Saratoga Results Analysis
How did Charting Horse Value do on 7/3/26

Opening day of the greatest horse racing meet in North America. We’ve been perfecting the new Charting Horse Value tool. Let’s look at the screen shot of the handicap report for Race 9 and explain each column. After we will dig into detail on how each of these key table parameters impact wagering decisions.
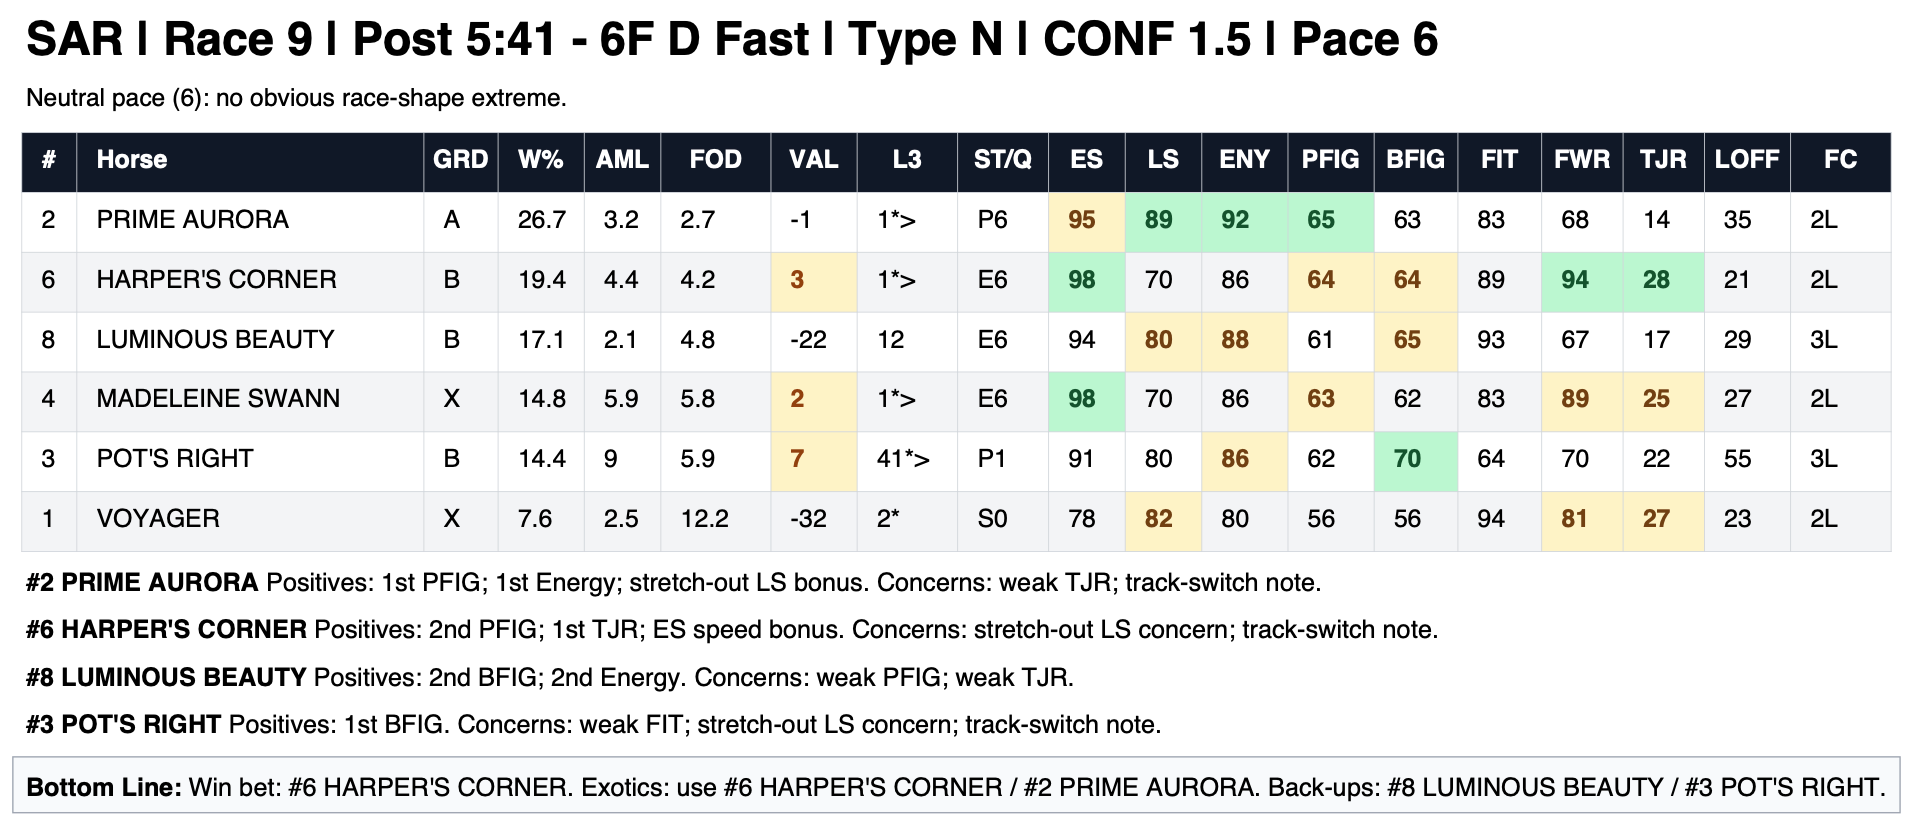
Going left to right:
RACE header - Type (N) is a listed stakes race. I have a blog on my website which explains all the different types of races. Type & Confidence Blog. Pace of 6 is neutral; we’ll learn later in our analysis that speed was golden yesterday.
GRD (Grade) is a letter grade for each horse that correlates to probability of winning. K horses win >40% of the time; A ~25%; B ~17%; C ~12% and X <6%.
W% (Modeled Win Probability) incorporates all the factors you see plus more into a probability of winning that turns in a letter grade above.
AML (Adjusted Morning Line) rebuilds the morning line after scratches.
FOD converts W% into a fair odds line.
VAL (Value) compares W% to AML. Higher is better.
L3 gives you finish position in a horse’s last 3 races. An asterisk “* means horse is unproven on new surfaces. “< or >” means horse is cutting back or stretching out in distance. This gets factored into the overall pace dynamics of the race.
ST/Q is the Quirin running style and probability horse will be on the lead.
ES is projected early speed; LS is projected late speed.
ENY (Energy) combines ES + LS into a number that changes depending on the distance and surface of the race.
PFIG is a projected performance figure. This is a proprietary measure that goes back 30 years for Charting Horse Value. No one builds this the way #CHV does.
BFIG is a best performance figure. This looks at the horse’s form cycle and recent races to see a best case scenario for the horse. When applicable this can signal an upset chance and we will upgrade the horse’s letter grade accordingly.
FIT is how well the horse fits this race’s distance and surface. 100% is perfect.
FWR (fitness work-out rating) is especially important for young inexperienced horses or horse’s coming off a layoff.
TJR (trainer jockey rating) looks at trainer and jockey angles along with over arching statistics to determine the strength of a horse’s connections. Very powerful rating.
LOFF is days of layoff
FC (Form Cycle) - see #CHV tutorial page for more details on this and other factors. CHV Tutorial
Okay now that we’ve explained everything let’s apply it to Race 9. You can read things for yourself but let’s look at the Bottom Line: Win Bet #6 Harper’s Corner. The chart does the analysis for you and makes this recommendation. Well Harper’s Corner won at 12-1. Here is a picture of the chart.
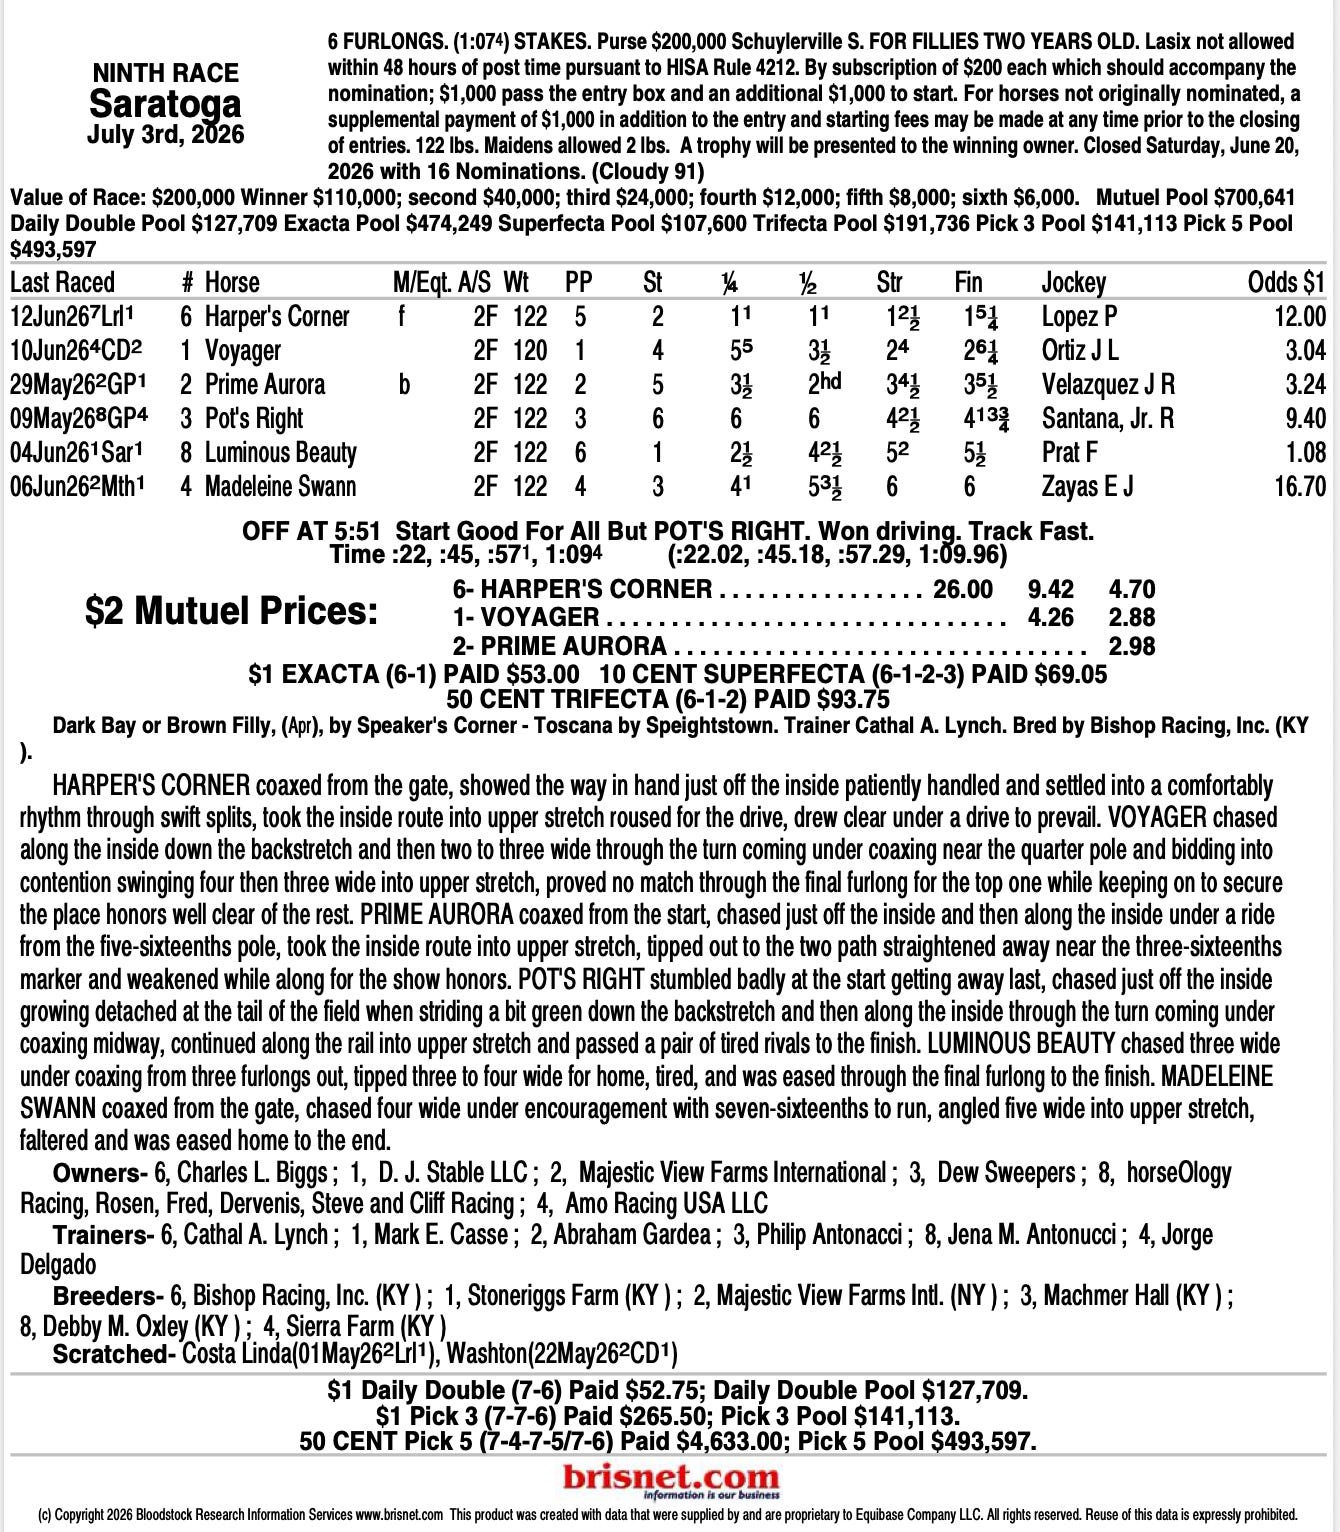
Wire 2 Wire!
Now let’s dig into how each of these 9 factors (W%, PFIG, BFIG, ENY, ES, LS, TJR, FWR, VAL) did yesterday for all eleven races.
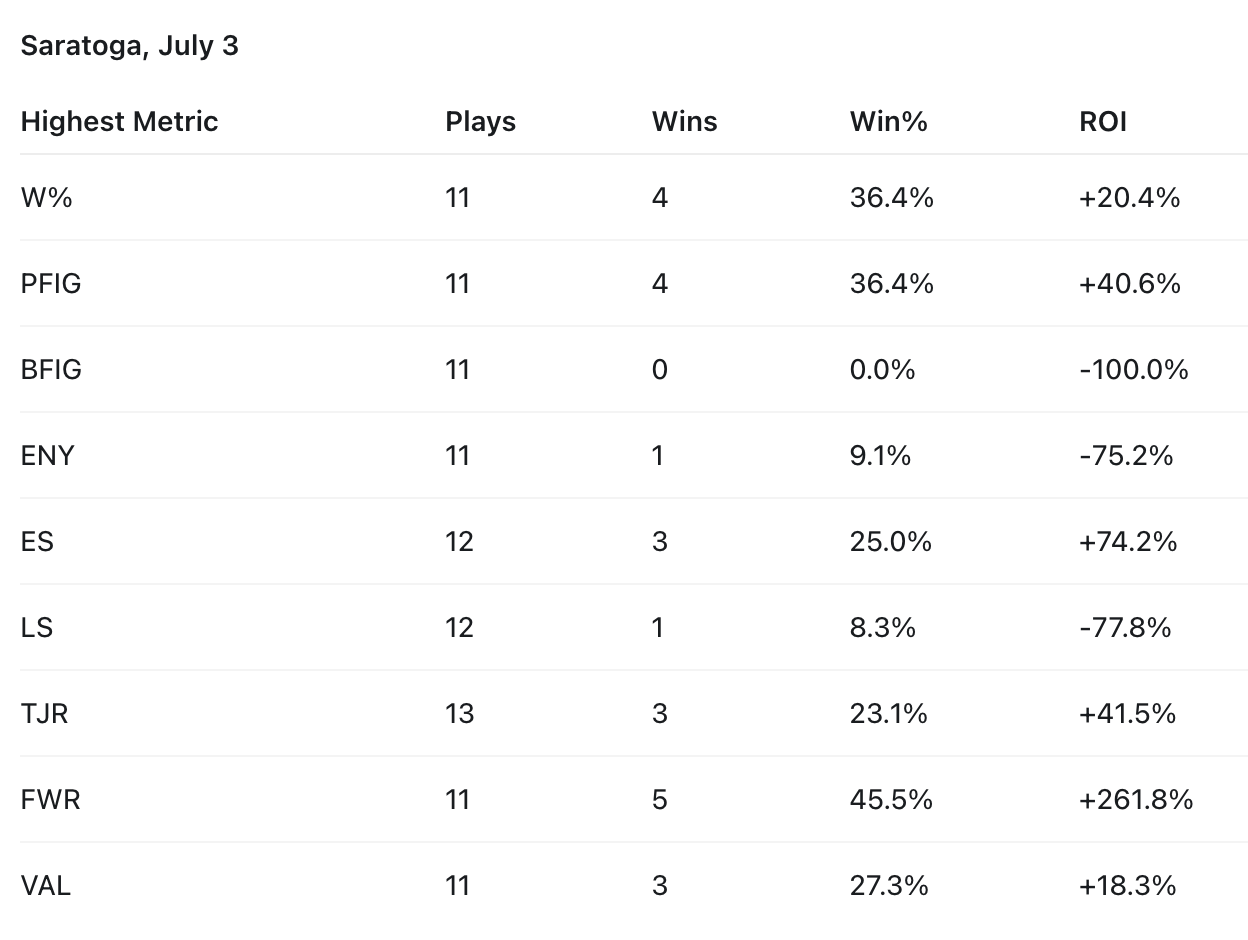
Looking at table above, only Best Fig and Late Speed under performed. With ES having +74% ROI with only 3 winners and LS underperforming we likely had an early speed bias yesterday. Fitness Work-out Rating is a factor that normally underperforms but historically at Saratoga is exceptionally strong. It didn't disappoint yesterday with 45% winners and +261% ROI (nearly quadrupling your money). The modeled Win %, which takes into account every factor and more, performed admirably.
If you want to read more about these factors yesterday at Saratoga with 2-factor combinations go here. Saratoga 7/3 Factor Analysis
Finally, we looked at horses that ranked first in 3 or more of the 9 factors. 14 horses met this screen in 11 races. If you bet them all, 6 won (43%) for +124% return on investment. Let’s do it again today.